In an earlier post I spoke about the Fuel surcharges that the Transportation faces, but failed to point out it has only just begun. The fuel surcharge has helped all industry leaders come close to just breaking even with their fuel expenditures but have not helped bring Carrier profits back up to satisfactory levels as seen in the surcharge raise by the TSA (Transpacific Stabilization Agreement) The TSA is made up of many top name carriers in the Container Shipping Industry and acts as a mediator group for any Industry issues.
Please read below from the American Shipper
Liner carriers in the Transpacific Stabilization Agreement said Monday that their floating bunker fuel surcharge will spike to a record level effective Sept. 1.
"The higher surcharge reflects record fuel prices that topped $767 per ton in mid-July, up from $500 at the beginning of 2008 and $296 at the beginning of 2007," TSA said in a statement.
TSA’s surcharge is adjusted monthly according to a formula that tracks world fuel prices at key loading locations.
Although fuel prices have been falling of late, each month’s surcharge reflects average fuel prices during a reporting period 30 to 60 days earlier, said Bill Payne, NYK Line vice president and TSA revenue policy committee member. This is done to comply with U.S. law requiring a minimum 30 days’ advance notice to the market in the event a particular rate or surcharge is to be raised.
“Carriers pay the higher fuel costs out of pocket as those costs rise, cushioning the impact on shippers, and then must pass them through after the fact,” Payne said. “The good news with a floating formula is that, as prices fall, customers will start to see savings 30 to 60 days out.”
The new fuel surcharges will be $1,886 per 45-foot container, $1,676 per high-cube 40-foot container, $1,490 per 40 footer, $1,192 per TEU and $33 per metric ton or cubic meter.
The TSA surcharge is posted by the carrier group as a guideline for the market, but service contracts with customers -- including bunker surcharge terms -- are addressed individually by the lines.
APL Senior Vice President Bob Sappio, also an RPC committee member, said that while carriers and shippers have made significant progress in agreeing on a floating fuel surcharge, much more work remains.
“If people think the high price of fuel is temporary they are mistaken,” Sappio said. “The transpacific trade is simply not sustainable as it is presently constituted. Carriers must recover a greater percentage of actual dollars spent on fuel.”
TSA members are: APL, “K” Line, China Shipping Container Lines, Mediterranean Shipping Co., CMA-CGM, MOL, COSCO Container Lines, NYK Line, Evergreen Line, OOCL, Hanjin Shipping Co., Yangming Marine Transport, Hapag-Lloyd, Zim and Hyundai Merchant Marine Co.
As you can see, Fuel Surcharges for Carriers has only just begun. As a result the more costs associated with shipping goods, the more it costs to buy the goods, The Trickle Down Effect.
August 26, 2008
August 25, 2008
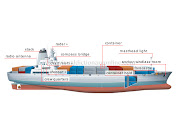
Vessel schedule Integrity and Canals
Container vessel schedules are very tight for each voyage. There is very little room for tardiness and even less room to make up for any lost time.
Most liner vessel services are made up of 7-8 vessel completing the same route. Each time a vessel completes its service route the voyage number changes. These services carry many different shipper cargo and each of whom are watching the calender for when the vessel is scheduled to arrive. If the vessel is any amount of time off that schedule the shippers want to know why and are reasonably upset. These delays in the schedule can be caused by many different variables. The first group is called 'uncontrolled.'
The uncontrolled group is made up of any variable that can not be controlled by the vessel master or the vessel schedule manager such as; weather, engine malfunction, Government inspections, natural or unnatural disaster, canal or harbor closings, berth congestion, and many others that can not be foreseen. Berth congestion is a tricky variable that many different sectors blame the others for. Berth congestion can be just that, too many vessel in one area at the same time or a delayed vessel causing others to be delayed. One delayed vessel at a scheduled terminal causing a domino affect on other vessels that are on-time. Some smaller terminals can not fit more then 2/3 vessels on the dock, thus delaying waiting vessels.
The second group are controlled variables such as; volume surges, terminal production, vessel speed, port skips. Out of this group, the port skips category is the most controversial, because sometimes the only way for a Carrier to get their vessel back on schedule, is to skip a smaller port. When a port is skipped the import cargo must be discharged in the next closest port and the export cargo is then rolled to the next vessel in that particular vessel's service. It is very difficult to explain to a shipper why a Carrier skipped their POC and their cargo could not load.
Vessel Integrity is different depending on what US coast you are working out of. The West Coast services have much more extra time built in to their schedule and must only cross one ocean. This is a much easier route, but much more congested. The US East Coast services have extremely tight schedules and do not have much extra time built into the schedules. USEC services also have to work their schedules around the canal they choose to use. For India/Asian/USEC services most Carriers will use the Suez canal. Suez canal services travel longer distances and must face Atlantic Ocean weather but are typically much less expensive to transit, much less congested, and at this time pass larger ships through. Other USEC service vessels must pass through the Panama canal The Panama canal vessels face many delay issues here. The PC is constantly dredging and due to the narrowness of sections can only move a certain amount of vessels and size vessels. The PC also services vessels that have pre-scheduled their transit a year in advance, and the vessel must transit that delay or forfeit their spot. Once a vessel misses their scheduled transit they must buy an auctioned spot from 50,000 USD to 500,000 USD. This can delay a vessel greatly and cost an enormous amount of money.
All these factors cause vessel Service Integrity to be the most difficult part of a Carriers service to provide, yet the most important and Customer driven objective.
August 20, 2008
Fuel Surcharges and Floating Bunker Rates
The largest cost in the industry is Fuel, whether it is bunker, diesel, gasoline, or any other petroleum . This not only affects the vessel operators, but all facets of the industry that many people do not consider. Fuel prices have a large affect on: Tugs used to dock and undock the vessels at their berths, Diesel STS gantry cranes, Terminal equipment, OTR Truckers, Warehouse machinery, Rail Road Engines, and ect. In other words everybody is paying more to move goods and of course this increases the cost of all products at the stores.
So the question remains; Who pays for all the rising fuel costs?
Right now, everybody. How can this be made more fair and passed around fairly. At the end of the day the only entity not making out are the consumers. Does the consumer have a floating price of bread compared to the price of a barrel of oil? Of course not, but every other part of the logistics chain does. So the consumer makes out when oil goes up, but loses out as it decreases. How is this rectefied? The short answer is: It isnt.
A floating bunker surcharge is being used by the carriers but it does not make them "whole." The surcharge does not fully cover the price of fuel, so this eats into the carrier's profit margins. After that, the Tugs have fuel surcharge rates, terminals have fuel surcharges added in for each TEU shipped through, Truckers have a floating fuel rate added into the base rate, and so on and so forth.
The Floating fuel surcharges must be accepted by all aspects of the industry for it to work out properly. If it is not, some organizations are big winners and other big losers. The industry must work this into all contracts so that everybody is on an even playing field. All surcharges should be based on the price of a barrel of oil and not every different type of fuel.
 Anybody for a comment or input.
August 19, 2008
Goethals Bridge, NY/NJ Port Authority behind the times
Posting from the American Shipper: The Port Authority of New York and New Jersey has unveiled preliminary renderings for a new bridge to replace the 80-year-old Goethals Bridge, one of three crossings that connect New York's Staten Island to New Jersey.
The others are the Bayonne Bridge and Outerbridge Crossing.
The agency said the current bridge is in need of major rehabilitation and frequently causes congestion due to its antiquated, narrow design.
The new, cable-stayed bridge would have six 12-foot-wide lanes with full shoulders in both directions and a sidewalk/bikeway. There is also room for a future mass transit link.
The current bridge has four 10-foot-wide lanes without shoulders, so even minor traffic mishaps often cause major delays.
The New York Container Terminal at Howland Hook is located just north of the bridge, and trucks draying cargo to and from the terminal pass over the Goethals Bridge. The Port Authority and New York last year completed rehabilitation of a separate rail bridge that serves the container terminal.
The renderings show the new bridge located to the south of the existing bridge location, which was the port authority's original proposal to the U.S. Coast Guard at the beginning of the Environmental Impact Statement. Alternative alignments with the new bridge on the north side of the existing bridge also are being evaluated.
The agency's preliminary plan aims to begin awarding construction contracts in 2011, with bridge completion in 2015.
The port authority's 10-year capital plan earmarks $1 billion for the project. The final cost estimates for the project have not been determined as the design process is still in its early stages.
My Opinion:
I think the NYNJ PA is too late with their plan for a new bridge. By the time this bridge is built and the Bayonne Bridge is reconstructed the East Coast surge volume will have found other ports to fill. A region must be ahead of the curve, and by that I mean have the foresight to eliminate any obstacles that reduces the capacity of its port. The Goethals bridge and the Bayonne Bridge limit the size vessels that can call the NY/NJ Ports because of the air draft restrictions they create.
As soon as the Panama Canal expansion is completed, Carriers will be adding much large TEU vessels to their US East Coast fleets and these vessels will not be able to fit into the New York Harbor. Are Carriers going to modify their vessels so they can fit under the bridges. I strongly doubt it.
The others are the Bayonne Bridge and Outerbridge Crossing.
The agency said the current bridge is in need of major rehabilitation and frequently causes congestion due to its antiquated, narrow design.
The new, cable-stayed bridge would have six 12-foot-wide lanes with full shoulders in both directions and a sidewalk/bikeway. There is also room for a future mass transit link.
The current bridge has four 10-foot-wide lanes without shoulders, so even minor traffic mishaps often cause major delays.
 |
| The current bridge deck with narrow lanes and no shoulder. |
 |
| Rendering showing the increased number of lanes, the wider lanes and the added shoulder. |
The New York Container Terminal at Howland Hook is located just north of the bridge, and trucks draying cargo to and from the terminal pass over the Goethals Bridge. The Port Authority and New York last year completed rehabilitation of a separate rail bridge that serves the container terminal.
The renderings show the new bridge located to the south of the existing bridge location, which was the port authority's original proposal to the U.S. Coast Guard at the beginning of the Environmental Impact Statement. Alternative alignments with the new bridge on the north side of the existing bridge also are being evaluated.
The agency's preliminary plan aims to begin awarding construction contracts in 2011, with bridge completion in 2015.
The port authority's 10-year capital plan earmarks $1 billion for the project. The final cost estimates for the project have not been determined as the design process is still in its early stages.
My Opinion:
I think the NYNJ PA is too late with their plan for a new bridge. By the time this bridge is built and the Bayonne Bridge is reconstructed the East Coast surge volume will have found other ports to fill. A region must be ahead of the curve, and by that I mean have the foresight to eliminate any obstacles that reduces the capacity of its port. The Goethals bridge and the Bayonne Bridge limit the size vessels that can call the NY/NJ Ports because of the air draft restrictions they create.
As soon as the Panama Canal expansion is completed, Carriers will be adding much large TEU vessels to their US East Coast fleets and these vessels will not be able to fit into the New York Harbor. Are Carriers going to modify their vessels so they can fit under the bridges. I strongly doubt it.
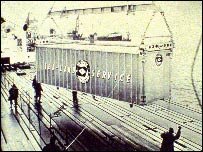
History of Overseas container shipping
History
What led to the container becoming the method of choice to move manufactured goods around the World?
Life before the box
For many thousands of years, mankind has shipped goods across the oceans, from one land to another. Think of the great seafaring peoples; the Phoenicians, Egyptians, Greeks, Romans, Portuguese, Spanish, British and many more. Sailing the world looking for new treasures, they brought home and traded food, jewels and materials that their countrymen had never seen before.
But the process was never easy. The loading and unloading of individual goods in barrels, sacks and wooden crates from land transport to ship and back again on arrival was slow and cumbersome to say the least. Even up to the second half of the 20th Century, this ‘break-bulk’ system was still in use and cargo was often carried by passenger vessels as well as later by general cargo vessels.
Loading and unloading was very labour intensive: a vessel might easily spend more time in port than at sea while dockworkers manhandled cargo into and out of tight spaces below decks. There was also high risk of accident, loss and theft.
There were some basic systems in place to make the process more efficient, such as the use of rope for bundling timber, sacks for carrying coffee beans, and pallets for stacking and transporting bags or sacks. However, industrial and technological advances, such as the spread of the railways in the 18th century, highlighted the inadequacies of the cargo shipping system. The transfer of cargo from trains to ships and vice versa became a real problem.
The birth of the modern container and ‘intermodalism’
Before the container shipping industry emerged, boxes of various types and sizes had often been used in transporting cargo simply because they were the logical way to move things en masse from one location to another. Boxes similar to modern containers had been used for combined rail- and horse-drawn transport in England as early as 1792. The US government used small standard-sized containers during the Second World War, which proved a means of quickly and efficiently unloading and distributing supplies. Instead of shipping commodities in bulk, army and navy specialists began to mix cargo by loading it onto pallets, then loading the pallets into specially constructed boxes. However, despite these developments, cargo handling was almost as labour-intensive after World War II as it had been in the mid-1800s.
Then, in 1955, Malcolm McLean, a trucking entrepreneur from North Carolina, USA, bought a steamship company with the idea of transporting entire truck trailers with their cargo still inside. He realised it would be much simpler and quicker to have one container that could be lifted from a vehicle directly on to a ship without first having to unload its contents.
These ideas were based on the theory that efficiency could be vastly improved through a system of ‘intermodalism’, in which the same container, with the same cargo, can be transported with minimum interruption via different transport modes during its journey. Containers could be moved seamlessly between ships, trucks and trains. It would simplify the whole logistical process and, eventually, lead to a revolution in cargo transportation and international trade over the next 50 years.
But to realise intermodal cargo transport all areas of the logistical chain needed to be considered: not just the containers, but the ships, terminals, trucks and trains would need to be adapted to carry them.
It was a logical step that container sizes should be standardised so that they could be most efficiently stacked and so that ships, trains, trucks and cranes could be specially-fitted or built to a single size specification. This standardisation would eventually need to apply across the global industry as container shipping companies began to carry containers belonging to other lines.
In 1960 international steering groups began discussing what the standard container sizes should be and in 1961 the International Organisation for Standardisation set standard sizes of which the two most important were, 20-, and 40-foot lengths. The 20-foot container, referred to as a Twenty-foot Equivalent Unit (TEU), became the industry standard reference with container traffic and vessel capacity being measured in TEUs. The 40-foot length container - literally ‘2 TEUs’ – became known as the Forty-foot Equivalent Unit (FEU).
The birth of the container ship
On 26 April 1956, Malcolm McLean’s converted Second World War tanker, Ideal X, made its maiden journey from Port Newark to Houston in the USA. It had a reinforced deck carrying 58 metal container boxes as well as 15,000 tons of bulk petroleum. By the time the container ship docked at the Port of Houston six days later the company was already taking orders to ship goods back north in containers. McLean's enterprise became known as Sea-Land Services, a company whose ships carried cargo-laden truck trailers between Northern and Southern ports in the USA.
Other companies soon turned to this approach. Two years later, Matson Navigation Company’s ship Hawaiian Merchant began container shipping in the Pacific, carrying 20 containers from Alameda to Honolulu. In 1960, Matson Navigation Company completed construction of the Hawaiian Citizen, the Pacific’s first full container ship. Meanwhile, the first ship specifically designed for transporting containers, Sea-Land’s Gateway City, made its maiden voyage on 4 October 1957 from New Jersey to Miami , starting a regular journey between Port Newark, Miami, Houston and Tampa. It required only two gangs of dockworkers to load and unload, and could move cargo at the rate of 264 tons an hour. Shortly afterwards, in 1960, Sea-Land’s 610 20-foot container vessel Supanya was launched.
Container shipping goes global
On 23 April 1966, ten years after the first converted container ship sailed, Sea-Land’s Fairland sailed from Port Elizabeth in the USA to Rotterdam in the Netherlands with 236 containers. This was the first international voyage of a container ship.
Meanwhile, during the rapid build-up to the Vietnam War, the US military was faced with the logistical problem of getting supplies to troops. It had somehow to transport mass supplies to a war zone in south-east Asia through a single under-developed port on the Saigon River and a partially-functioning railway. The government turned to container shipping as the most efficient option.
Container shipping began to prove its worth at an international level. From this point on the industry began to grow to the point where it would quickly become the backbone of global trade, even though few at the time would have made such bold predictions.
Climbing investment and industry growth
1968 and 1969 were the Baby Boomer years for container shipping. In 1968 alone, 18 container vessels were built, ten of them with a capacity of 1,000 TEUs which was large for the time. In 1969, 25 ships were built and the size of the largest ships increased to approaching 2,000 TEU. In 1972, the first container ships with a capacity of more than 3,000 TEU were completed by the Howaldtwerke Shipyard in Germany.
Now an entire industry had emerged, demanding unprecedented investment in vessels, containers, terminals, offices and information technology to manage the complex logistics.
Crucially, containerisation demanded new and very different ports. Container terminals soon became an important link in the chain of intermodalism.
To meet rising demand for its services, the shipping community began to consolidate in the mid- and late-1960s, with competitors based in the same country joining forces to pool resources. An early example is Overseas Containers Ltd. (OCL) which was formed on 27 August 1965 by four British companies: Ocean Transport and Trading, P&O, British & Commonwealth, and Furness Withy. In turn shipping lines formed consortia with like-minded companies to offer economies of scale needed to make the containerisation process a success.. OCL joined with Hapag Lloyd (Germany), Nedlloyd (Netherlands), Compagnie Generale Maritime (France), and Lloyd Triestino (Italy) to form the first international consortium to start a containerised service between Europe and Australia.
All of these companies were competitors in other trades but co-operated in container shipping to overcome the vast initial investments necessary in the seismic change from ‘break bulk’ to container shipping. They still faced competition from another company called Associated Container Transport (ACT) which was formed to service the Europe-Australia trade route. Its members were Ellerman, Blue Star, Ben Line, Harrison and Port Line. ACT then turned to work with Australia National Line. These services were the trailblazers in Europe. Ships were being custom-built to carry a significant number of refrigerated containers so that Australian exports of fruit, meat and dairy products - which were critical market segments – could be brought to Europe.
In Europe, container ports and dedicated freight trains were developed and river barges, especially on the Rhine, were adapted to carry containers inland. In 1989 the Transpacific Stabilization Agreement was formed by 13 carriers operating in the eastbound East Asia-USA trade routes in an effort to provide stability in freight rates.
Throughout the 1970s and 1980s the container shipping industry grew exponentially. There were now connections between Japan and the US west coast, and Europe and the US east coast. Once the Australia-Europe service was established, the Europe–Asia route began to be serviced by consortia in the early 1970s alongside some independent services. By the end of the decade, shipping between Europe, South East and Eastern Asia, South Africa, Australia/New Zealand, North America and South America were all largely containerised. In 1973, US, European and Asian liners were carrying 4 million TEUs all over the world. By 1983, this would rise to 12 million TEUs by which time containers had also arrived in the Middle East, the Indian sub-Continent, and East and West Africa.
Throughout the 1980s many new companies saw opportunities to enter the container shipping business. The US government started to liberalise the liner shipping industry by enacting the 1984 Shipping Act. This minimised government intervention in the industry and aimed to increase efficiencies in ocean cargo transportation. Inevitably, some of the industry players prospered in this environment and others disappeared.
Meanwhile the container shipping industry grew apace, particularly in Asia. In 1989, Hong Kong became the biggest container port in the world, capable of handling 4.5 million TEUs. In 1994 Hong Kong and Singapore both passed the 10 million TEU capacity barrier.
The present-day industry is truly global and touches all our lives in ways we cannot imagine. And it continues to expand: over the last five years, the volume of loaded containers moved has seen growth averaging approximately 10% each year. In 2007, it is estimated that global loaded container trade reached 141 million TEUs for the first time ever, representing a 12% increase compared to 2006*.
As China became a factory for the world the country proved to be a great catalyst for this continuing growth trend. Not only exporting all kinds of articles, China also needs to import to support its manufacturing and packaging needs, as do Japan, India and other South-east Asia manufacturing countries. The increasing urban population in China is proving a magnet for goods produced elsewhere too.
In short, patterns of trade are rapidly changing and the container is a vital link in allowing these changes to happen.
Subscribe to:
Posts (Atom)